
Features Trade chart patterns
Trading and investing in stocks and financial instruments is becoming more profitable, when using price patterns.
⭐️ Investors get information mostly from fundamental data, but when they use technical or graphical analysis, there buys and sells can be more precise.
⚡️Technical analysis is extremely powerful especially when trading short-term starting from days to several months and more.
"Trend is your friend" - that words are familiar to professionals and even to beginners.
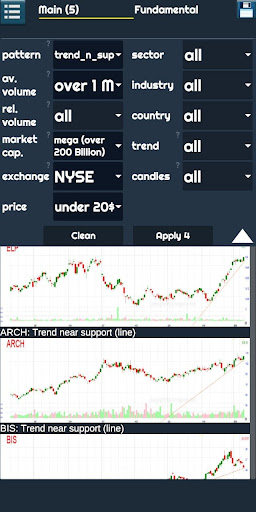
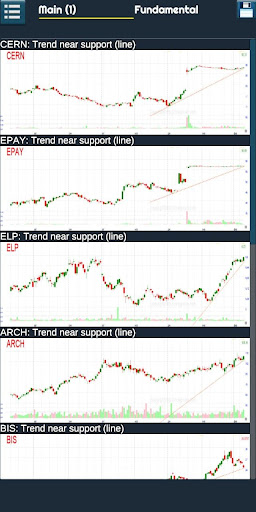
🔹 We can offer you trend indicators to filter those stocks that are going up or down.
🔹 Channel, breakthrough support/resistance, new high and new low.
🔹 Some traders like channels and stocks being flat for some time.
We also can filter out flat (range) patterns for your convenience.
🔹 You can filter out stocks using pattern, price, market capitalization, sector or industry, average and relative volume, P/E, P/S etc.Save your time and money with the help of our app, because you can filter from 6000 stock only those, that match your criteria and technically look good!
Financial Tools
Manage your finances and track your expenses easily.
Shopping Features
Shop online and find the best deals.
24/7 Support
Our dedicated support team is always ready to help you.
See the Trade chart patterns in Action

Get the App Today
Available for Android 8.0 and above